August 4, 2025 • 15 min read
How to Measure Customer Experience: Key Metrics to Track

Content Writer
August 4, 2025
Customer experience measurement transforms raw interaction data into strategic insights that drive business growth. Customer-obsessed organizations report 41% faster revenue growth and 49% faster profit growth than non-customer-obsessed organizations, highlighting the critical business impact of comprehensive CX strategies.[*]
Yet many companies struggle to translate feedback into meaningful improvements. This guide explores essential metrics, implementation frameworks, and proven strategies to build a measurement program that delivers actionable insights and sustainable competitive advantage.
What Is Customer Experience Measurement?
Customer experience (CX) measurement covers how we track, analyze, and act on all the data collected from interactions with customers from each stage of the buying journey. It answers the questions:
- How do customers see your brand?
- What was their first impression?
- Are they sticking around after that first purchase?
By putting together satisfaction, effort, and retention scores, CX measurement gives businesses what they need to find fiction points, continually improve, and create strategic decisions that align with real customer behaviors. Brands evolve to meet the marks and score higher loyalty, less churn, and sustainable growth.
Core Customer Experience Metrics
Measuring CX well requires a balanced set of metrics that take in the whole picture: loyalty, efficiency, satisfaction, and business proposition value. We’re breaking down these metrics into four strong categories to show you where and when these matter most:
Satisfaction and Loyalty Indicators
These metrics are how your customers feel about their experience both momentarily and throughout their lifespan as a customer.
Net Promoter Score (NPS): Measure customer loyalty through asking how likely someone is to recommend your business.
The formula: % of Promoters (score 9–10) – % of Detractors (score 0–6)
Imagine 65% are promoters and 15% are detractors, this leads to a NPS of +50.
Customer Satisfaction Score (CSAT): Assess the levels of satisfaction with a specific interaction, product, or service.
The formula: (Number of satisfied responses ÷ total responses) × 100
If after a live chat, 59 of your customers give you a thumbs up or a positive response, your CSAT becomes 59%
Customer Effort Score (CES): Evaluate how easy it was for customers to complete a task or resolve an issue using prompts like “How easy was it to get what you needed today?”
If 75% of your respondents say yes or rank the task as “super easy”, your CES is 75%
Operational Performance Metrics
These operational performance metrics show how fast and effective your team is at tackling customer needs.
- First Response Time (FRT): This simply measures the time to first reply.
Example: If your team replies in 3 minutes, your FRT is 2 min.
Average Resolution Time (ART): Measure how long it takes to fully resolve an issue.
The formula: Total resolution time ÷ number of resolved tickets
If 70 agents resolve 100 tickets in 200 hours, that’s an ART of 2 hours.
First Contact Resolution (FCR): This metric accounts for the percentage of cases resolved on first interaction without any follow-up.
The formula: (Resolved on first contact ÷ total tickets) × 100
So if 92 of your 100 cases are closed on the first shot that means your FCR is 92%.
Retention and Value Metrics
These metrics show you how well you retain customers and what they bring to your bottom line over time.
Customer Lifetime Value (CLV or CLTV): This encompasses the predicted total revenue a customer will generate during their relationship with your brand.
The formula: Average purchase value × purchase frequency × customer lifespan
If $50 is the cost of an average order from your customer and they purchase 10 times per year over 3 years, their CLV = $1,500
Customer Churn Rate: This encompasses the predicted total revenue a customer will generate during their relationship with your brand.
The formula: (Customers lost ÷ total customers at start of period) × 100
You lose 40 customers from a base of 1,000, the churn rate is 4%
Retention Rate: This measures the percentage of customers you keep over a period.
The formula: ((End customers – new customers) ÷ starting customers) × 100
If you start with 500 customers, gain 50 more, but somehow end with 480, your retention rate is 86%.
Financial Impact Metrics
Metrics that tie your CX to the bottom line allow you to evaluate the cost-effectiveness and potential revenue of your customer relationships.
Customer Acquisition Cost (CAC): The average cost to acquire a new customer.
The formula: Total marketing and sales costs ÷ number of new customers
If you spend $10,000 to acquire 200 customers, your CAC is $50.
Revenue per Customer: Average amount of revenue generated per customer over a period.
The formula: Total revenue ÷ total number of customers
If you get $250,000 in revenue from 500 customers, the revenue per customer is $500
Win-back Rate: Percentage of previously churned customers who return.
The formula: Total revenue ÷ total number of customers
If 20 of 100 of your churned customers return, you have a win-back rate of 20%.
Setting Up Your CX Measurement Program
Successful CX measurement always starts with clarity: you need to know what you’re measuring, how you plan to do that, and how to actually do something with those metrics. These steps are here to get you started:
Step 1: Define Clear CX Objectives
You need to know exactly what you’re doing this all for. Your purpose, but also be sure to tie together your measurements to your business outcomes first and foremost.
- Figure out how to align your specific CX goals with business outcomes. In the event, you want to reduce churn or even boost your CSAT goals, realizing both require different strategies and expectations
- Instead of chasing phantom or moving targets, uncover the baseline data to ensure you know when and where progress is being made
- Mapping the journey stages means knowing where to look at (think about the onboarding steps, support stages, and renewal processes)
Step 2: Choose Your Measurement Framework
Decide exactly what you’re tracking, how you plan to do that, and how frequently you’re going to do this whole process.
- Set a real cadence: Decide on frequency (usually this means real-time, monthly, or quarterly)
- Select 3–5 core metrics (e.g., NPS, CSAT, FCR) and plus that by using supporting indicators
- Pick which collection methods are going to be chosen: surveys, behavioral analytics, support logs
Step 3: Build an Implementation Roadmap
Establishing a CX measurement program is about building a focused, intentional system tied explicitly to business outcomes. For a quick recap: begin with clear objectives, parse out exactly how and when you plan to track, then create an interlocked plan that allows all of your team to pitch in with their expertise.
- Prioritize high-impact touchpoints for rollout: your checkouts, your support calls, or the ways your customers cancel memberships or orders
- Assign internal ownership across CX, product, and support teams
- Equip your teams with real training and tools they understand to enable consistent data collection
How to Collect Customer Experience Data
CX measurement is pretty much gathering insights from all sorts of places because surveys really do not tell the entire story. This section outlines three primary pathways for getting this data as well as tools that help you aggregate and act:
Direct Feedback Channels
Direct customer responses gathered intentionally require structured outreach regardless of the formatting.
- Surveys (post-interaction, CSAT/NPS/CES templates): These are the quick and scalable standardized cornerstones for the CX measurement process. A recent study showed that 89% of B2C firms use structured surveys as a primary VoC method.[*]
- Interviews and focus groups: These qualitative methods are your tools for finding emotional context and unmet needs when designing your products or improving the onboarding process
- Customer support conversations: Your helpdesk is the motherload when it comes to striking for gold and candid feedback, analyze your transcripts or ticket threads to define the real recurring pain points
Here are few ways to use tools to maximize your direct feedback channels:
- Use CSAT popups after a support chat on Zendesk
- Deploy NPS email campaigns via Delighted or Qualtrics
- Collect CES data post-checkout or task completion using Typeform
- Host small-group product feedback sessions via FocusGroupIt
- Apply AI-based sentiment scoring in Gong.io for support call analysis
Indirect Feedback Sources
Both behavioral and public data are your direct eyeline sights into what customers say and do when the surveys fail to capture those.
- Social listening and sentiment analysis (e.g., Twitter, Reddit, Trustpilot): These tools are all about seeing where your brands are mentioned, emotional tones across these platforms and their favorite platforms.
- Online reviews (e.g., Google, Yelp): Third-party reviews are the raw and unsolicited feedback that ultimately reflects the ways your customers really feel about you. They are not guided, they’re voluntary, and sometimes brutal but 49% of customers trust them just as much as personal recommendations.[*]
- Behavior and interaction analytics from your CX or CRM platform: Keep score of the ways your customers interact with the site and products to see where people just say “I’ve had it, I’m done with you.”
Here are few ways to use tools to keep score on your indirect feedback sources:
- Track Reddit conversations about your product with Brandwatch
- Set up Twitter sentiment alerts in Sprout Social
- Analyze Trustpilot reviews with Talkwalker dashboards
- Analyze Google and Yelp reviews for store-level CX gaps
- Capture rage clicks and journey drop-offs via FullStory
- Monitor product usage flows with Mixpanel or Amplitude
Internal Team Insights
The input of your employees who see first hand where customer friction leads to loss and frustration is also another factor to keep tabs on. Companies that manage to use both structured and unstructured CX data sources are nearly 2x likely to outperform their nearest competitors.[*]
- Frontline team debriefs: Take it from your support and sales and service teams who deal with customers on the daily: they know where things are going downhill way before you even get the data on it
- Support ticket trends and tagging: Analyzing and categorizing your ticks through time will find the issues and the causes behind those issues that really grind your customers’ gears.
- Product usage logs and usage heatmaps: You need to know how your customers are using your products and what features they find confusing or are ignoring to see what’s causing confusion and eventually churn
Here are few ways to use tools to leverage your team’s inside knowledge:
- Auto-tag and filter tickets in Zendesk by issue type or escalation status
- Weekly CX syncs with support and product teams using Notion or Confluence
- Set up a Slack channel for real-time CX observations and feedback
- Track feature adoption across user cohorts in Pendo
- Identify onboarding drop-off using Heap or Amplitude
Customer Journey and Behavior Analysis
Understanding CX is a lot like the iconic phrase from the 2009 hit film, Avatar, “I see you.” Journey mapping and personal development are the eyes in which you see the customers themselves and how to make them see you as a lifelong partner.
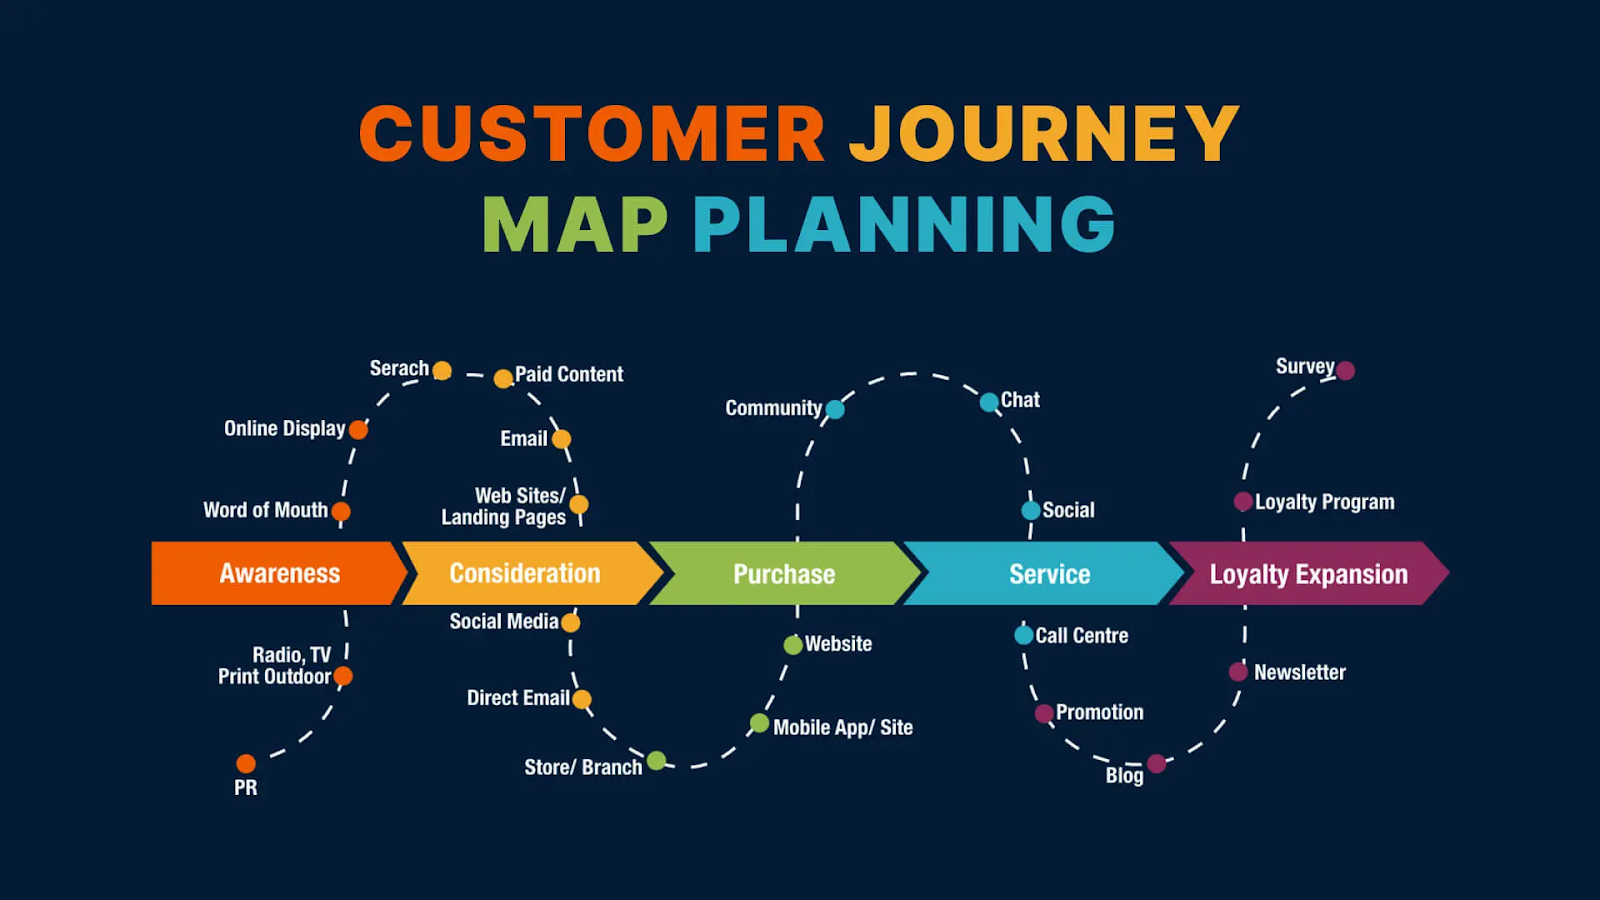
Journey Mapping
Great journey maps capture the whole experience whether that’s the discovery stage and when the buying happens to the support stages and eventually the renewal/upselling periods. These maps show you where the emotions hit a fever pitch or just die out, where friction happens, and the areas where customers are surprised or delighted.
A journey map is a living breathing document that accounts for all the channels (websites, apps, call centers) and when done justice: these uncover silos, missed opportunities, and bottlenecks.
Persona Development
Your personas are the face of your business data, these are the keys that ultimately help you group together your customers by shared needs, goals, and behaviors. You have to start with the CRM and the behavioral analytics and eventually layer in emotional drivers and the motivations behind the customer actions in surveys and support logs. The right personas allow you to create tailored and scaled experiences.
Analyzing and Reporting on CX Metrics
Collecting data doesn’t mean the job’s done. Far from it, the real value is translation of the data into insights and then converting those into decisions that matter.
Data Aggregation and Integration
CX data needs to occupy different systems: CRM platforms, analytics dashboards, support and help desk software. Real-time dashboards are what your frontline teams need to act fast, while executive-level scorecards give your C-suite a quick look at the big trends driving the hard numbers.
Reporting Framework
Reports are nothing if they aren’t relevant, regular, or regimented. The three R’s should drive your operation. CX reporting needs to break down performance on a granular level (product lines, customer segments, and even region). Tying your CX outcomes to business results like how improving FCR would lead to better retention therefore bigger profits is a must to justify your expenditures.
Statistical Significance and Sample Sizes
Your data needs to carry real weight before it emboldens you to act, which means having sample sizes that are large enough to sustain real conclusions. The margin for error is not something to ignore, especially if you want to avoid making errors by relying on noisy outliers. Your data set is limited, the sooner you get this: the smarter your next best steps are.
Turning Insights into Action
Data means nothing without the people shaping it into something tangible and actionable. Still, you need some sort of system to turn your feedback into fixes and convert your insights into innovations that do something for you.
Close the Feedback Loop
When feedback comes in from your customers, you need to do everything in your power to get those addressed. Whether it means tackling support ticket follow-ups, taking down a bug that keeps coming up, or even thanking your users for their honest feedback using awards, closing the feedback loop is critical. Your teams’ follow-up tasks need to correspond with their specific understanding and toolkits. Expertise is “use it or lose it”.
Prioritize High-Impact Improvements
Fixes vary in depth and breadth, therefore you need to use root-cause analysis to seek out the real systemic issues and repair the parts of your journey that cause the most friction. Sometimes it’s the checkout page, other times it’s onboarding. Data needs to guide your methodology. A/B testing is a proven tool that shows you exactly what works before system-wide rollouts happen.
Continuous Improvement
CX is something that never stops, monitoring data post-launch is mission critical. Quarterly reviews to track progress and course-correct are too. CX thinking needs to be part of your bigger and broader strategy, if it’s something you think after-the-fact, you’re already behind.
Industry Benchmarks and Standards
Measuring CX only goes as far as you take it into the real world, do not isolate your numbers to just the organization. Industry benchmarks will underscore what you need to do to become a leader in the sector.
NPS Benchmarks by Sector
The following table was sourced from a recent study showing sector benchmarks.[*]
| Industry | Good NPS | Excellent NPS |
|---|---|---|
| SaaS | 30–40 | 50+ |
| Retail | 20–30 | 40+ |
| Financial Services | 30–40 | 60+ |
| Telecom | 10–20 | 30+ |
| Hospitality | 40–50 | 60+ |
CSAT and CES Standards
Getting how your CSAT score compares across industries is key, here’s a quick table showing what the benchmarks are across the sectors[*]:
| Industry / Sector | Benchmark CSAT Score |
|---|---|
| Hospitality & Hotels | ~82 % |
| Banking & Financial Services | ~79 % |
| E‑Commerce / Online Retail | ~79–80 % |
| Big Box Retail | ~76–78 % |
| Grocery / Supermarkets | ~78–79 % |
| Airlines / Travel | ~75–77 % |
| Software / SaaS | ~78 % |
| Internet / Media Platforms | ~73 % |
| Insurance | ~70–76 % |
Common Pitfalls and How to Avoid Them
The world’s finest CX programs can sometimes fall apart if they’re not built on solid ground, here are a few common snares teams run into when measuring CX and some ways to combat them.
| Pitfall | Solution |
|---|---|
| Over-reliance on a single metric | Implement a balanced scorecard approach by identifying multiple dimensions of customer experience, such as satisfaction, retention, and net promoter score (NPS). Assign owners to each metric, set clear targets, and review all of them in regular strategy meetings, ensuring strategic decisions reflect a holistic view rather than a single data point. |
| Survey fatigue | Cut survey frequency by mapping the customer journey and identifying only the most impactful touchpoints for feedback. Use adaptive surveys with branching logic to tailor questions to each customer’s recent activity. Send brief, targeted questions rather than lengthy general surveys. |
| Ignoring unstructured feedback | Use natural language processing (NLP) and sentiment analysis tools to systematically analyze open-ended comments, reviews, and social media mentions. Aggregate insights from these sources and integrate them into executive dashboards for action planning. |
| Acting without context | Always cross-reference feedback with operational data like customer segment, product version, or support history. Before acting, validate insights with at least two different sources (e.g., survey results corroborated by call transcripts or purchase data) to ensure interventions are accurately targeted. |
| Measuring everything without focus | Convene a stakeholder workshop to clarify the organization’s top objectives, then select three to five key metrics that directly track progress on these priorities. Regularly review and refine these metrics to ensure ongoing alignment with strategic goals. |
| Poor timing of feedback requests | Design automated triggers to send feedback requests immediately after critical customer interactions (think a support ticket closure or completed purchase.) Track response rates by timing and iterate to find the optimal moment that gets the most actionable feedback. |
| Lack of benchmark data | Proactively gather benchmark data by researching industry best practices, accessing third-party benchmark reports, or running internal benchmarking across teams and departments. Use these benchmarks both to set realistic targets and identify performance gaps. |
Avoiding common pitfalls requires not just awareness, but systematic, thoughtful action. By leveraging a balanced set of key metrics, carefully timing and personalizing feedback, and integrating both quantitative and qualitative insights, organizations can develop a truly comprehensive understanding of the customer experience. Establishing robust benchmarks and always acting with context ensures that insights translate to meaningful improvements. Ultimately, a well-rounded, disciplined approach positions businesses to foster loyalty, drive growth, and respond nimbly to evolving customer needs.
FAQs
Your goals determine what’s most “important.” NPS gauges loyalty, CSAT measures satisfaction, and FCR highlights support effectiveness. Most businesses use all three together because each facet carries their own weight.
Measure key metrics continuously or monthly. Use real-time feedback for support and transactional events. Run broader surveys quarterly or semi-annually.
Yes. Use behavioral data (e.g., usage patterns, drop-off points), sentiment analysis, and customer support logs to extract insights without direct surveys.
Correlate metrics like NPS and CSAT with retention, CLV, and churn.