Updated on January 20, 2026 • 20 min read
Top Customer Experience KPIs to Track in 2026

Content Writer
July 14, 2025

Standout customer service isn’t just good for business, it’s your competitive edge and main differentiator. We exist in a market where products and pricing can be replicated overnight, how you treat your customers is what sets you apart from the competition. Great CX is not guesswork, you need hard data, clear signals, and KPIs to help cut through the noise.
Customer experience KPIs grant you visibility into what’s working, what’s broken, and where to invest tomorrow. Whether it’s digital behavior or emotional sentiment, these KPIs are the benchmarks that tie customer satisfaction to your bottom line results and they are non-negotiable if long-term growth is your prerogative.
What Are Customer Experience KPIs?
Customer experience KPIs are tools that help businesses gauge how customers feel, behave, and respond across each touchpoint. While CX metrics explain the “what” in your equation, KPIs give you the “why”: insights to shape your strategy, improve services, and directly impact revenue.
CX KPIs tie customer sentiment, loyalty, and behavior to growth opportunities. Whereas, metrics track activity where KPIs track progress towards mission critical business goals. If you’re remotely serious about transforming your customer experience into your competitive advantage, these CX KPIs are your guiding north star, cornerstones to spotlight friction, flag opportunities, and ensure your team works smarter (not just harder).
What's Changed in CX Measurement for 2026
The way customers denote their satisfaction in the CX they receive has shifted dramatically. The KPIs we track need to evolve with those expectations. A strategy that felt cutting-edge two years ago won't pay the smallest dividends today, especially when AI is reforming support interactions, privacy regulations are tightening data access. Customer expectations are at an all-time high, dropping the ball is malpractice.
Here's what we found different about measuring CX in 2026:
AI-Assisted Resolution Is Now the Baseline
Your customers don't care whether a human or an AI solved their problem. They care about speed and accuracy. Traditional support KPIs need recalibration because of this shift. Companies using AI-first support platforms are seeing 40% faster response times, with some reducing first response from 15 minutes to 23 seconds, and AI implementations are leading to 87% reductions in average resolution times.[*] If you're still measuring agent productivity the old way, you're missing the full picture of your hybrid human-AI support operation.
Privacy-First Measurement Is Non-Negotiable
Stricter data regulations on a global scale are constricting and evolving, ergo those days of tracking every single customer behavior are over. Third-party cookies are obsolete in some cases, explicit consent is mandatory in more territories. The bottom-line is customers are far more stingy and stringent with what data they're sharing. CX teams need to get craftier about first-party data collection, relying more heavily on voluntary feedback mechanisms like surveys and engineering true measurement strategies which respect privacy boundaries. Actionable insights are possible if you create an environment where customers feel comfortable sharing information with you in exchange for a boundless and friction-free experience.
Real-Time Expectations Have Gone Mainstream
Batch reporting and monthly dashboards feel prehistoric to today's CX leaders. 90% of customers rate an immediate response as important or very important when they have a customer service question, with 60% defining "immediate" as 10 minutes or less.[*] Real-time monitoring has become table stakes. If you can't see a spike in chat wait times or a sudden dip in CSAT as it happens, you're already behind. The winning teams in 2026 spot patterns, identify friction, and deploy fixes within hours instead of weeks.
Emotional Intelligence Is Measurable Now
Customer Emotional Intensity is taking center stage as it shifts from a nice-to-have to a crucial asset. Natural language processing and sentiment analysis tools have grown up and become a north star in accurately tracking emotional signals across every customer interaction (at scale, too). Whether frustration is bubbling up in chat transcripts or delight is going viral through social mentions, you can now quantify the emotional journey in ways that felt like science fiction just a few years ago. This emotional data proves to be one of the strongest predictors of churn and advocacy.
Omnichannel Means Actually Omnichannel
Customers think in problems, whatever channel they elect to use to solve the issues is your onus and key to fortifying loyalty. They'll start a conversation on chat, follow up with you via email, then ultimately expect you to remember everything should they ring you on a call. In 2026, measuring CX means tracking the full journey across every touchpoint instead of siloed metrics per channel. Your KPIs need to reflect unified experiences rather than fragmented interactions. If your dashboard can't show you how a single customer moves through multiple channels, you need an upgrade.
The big picture is taking on a distinct shape: CX measurement in 2026 is agile, intelligent, privacy-aware, and more emotionally-driven. The companies winning on customer experience track the right KPIs and leverage insights actively to shield customers the whole way and their gains in the process.
Core Customer Sentiment KPIs
Customer sentiment is how your customers actually feel about your brand, your product offerings, and their experience. It is a squishier and subjective matter, but when measured right, it is the clearest vantage point into customer loyalty, advocacy, and churn risk.
Qualifying your emotional feedback allows you to track satisfaction, cut down friction, and establish a brand people actually love (and stay with). Below are four sentiment KPIs every CX leader should keep a pulse on.
At a Glance: Core Customer Sentiment KPIs
| KPI | What It Measures | Why It Matters |
|---|---|---|
| Net Promoter Score (NPS) | Likelihood customers will recommend your brand (0-10 scale) | Best predictor of growth and loyalty |
| Customer Satisfaction Score (CSAT) | Satisfaction after specific interactions (1-5 scale) | Captures immediate reaction to touchpoints while driving retention and repeat business |
| Customer Effort Score (CES) | How easy it was to solve a problem (1-7 scale) | Lower effort indicates higher retention |
| Customer Emotional Intensity | Strength of customer feelings (love, frustration, disappointment) | Emotional customers take action and predicts viral advocacy or rapid churn |

Net Promoter Score (NPS)
Net promoter score measures how likely a customer is to recommend your brand to others, usually on a scale from 0-10. It is the paramount loyalty metric and your best predictor for future growth. Studies show that companies with industry-leading NPS scores grow more than twice as fast as rivals.[*]
Here’s how to calculate it:
NPS = % of promoters (9-10) - % of detractors (0-6)
Customer Satisfaction Score (CSAT)
CSAT scores are all about gauging customer satisfaction right after a specific interaction, these are normally conducted via quick surveys on a 5-point scale. According to research, higher CSAT scores are tied to better retention and repeat services.[*]
Here’s how to calculate a CSAT score:
CSAT = (Number of satisfied customers / Total responses) × 100
(Satisfied meaning responses of 4 or 5 on a 5-point scale)
Customer Effort Score (CES)
A customer effort score (CES) measures how easy or how hard it was for your customer to get a problem solved or to complete a necessary task. Gartner says that reducing your customer effort score is one of the leading predictors for loyalty within the customer base, they say it is 40% more accurate as opposed to CSAT.[*]
Here’s how to calculate a CES score:
CES = Average your scores from survey responses (typically on a 1-7 scale, an average of 5 or 6 and higher is ideal)
Customer Emotional Intensity
Customer emotional intensity is a more qualitative metric measuring the strength (not just the direction) of how your customers feel towards your products (think love, disappointment, and frustration). Emotional intensity tends to influence the way viral word-of-mouth and churn touch your company. Highly emotional customers are likely to take action against or for your brand.[*]
How to calculate Customer Emotional Intensity varies:
Oftentimes it is derived from sentiment analysis tools or NLP models that take apart and account for text tone and keywords through chats, social media, and reviews.
Retention & Loyalty KPIs
Retention and loyalty KPIs track how well you’re turning satisfied customers into long-term, repeat buyers. These KPIs measure whether customers stick around, how often they return, and how much value they deliver over time.
At a Glance: Retention & Loyalty KPIs
| KPI | What It Measures | Why It Matters |
|---|---|---|
| Customer Retention Rate | Percentage of customers who stay over time | Studies show retention is cheaper than acquisition |
| Customer Churn Rate | Percentage of customers who leave during a period | Critical red flag, as many as 73% customers switch after one bad experience |
| Customer Lifetime Value (CLTV) | Total revenue from a customer over their lifetime | Determines sustainable acquisition spending while signaling when retention beats acquisition |
Customer Retention Rate
Customer retention rates take the percentage of customers who continue to use your service or product over a set period of time. Just increasing this metric by 5% can lead to profit increases anywhere from 25 to 95% pending on industry.[*]
Here’s how to calculate Customer Retention Rate:
Retention Rate = ((E − N) / S) × 100
(E = end-period customers, N = new customers, S = starting customers)
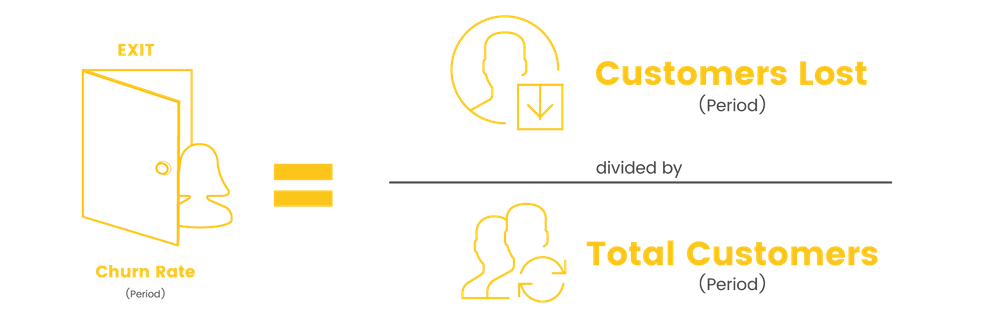
Customer Churn Rate
Customer churn rate on the other hand calculates the percentage of customers who stop doing business with you over a set period of time (most known as churn). Having high churn is a critical CX red flag, often meaning poor onboarding, weak value delivery, or some unaddressed friction point that causes customers to leave. 73% of customers say they will switch to a competitor after a bad experience.[*]
Here’s how to calculate Customer Churn Rate:
Churn Rate = (Customers lost during set period / Total customers at start) × 100
Customer Lifetime Value (CLTV)
Customer Lifetime Value (CLTV) is the projected net revenue from a single customer over the lifetime of their relationship to your company. CLTV can help you determine how much you can afford to spend on acquisition efforts and signals when retention is the best strategy. Research shows that customer acquisition costs average anywhere from $127 to $462 pending on industry.[*]
Here’s how to calculate CLTV:
CLTV = Average Purchase Value × Purchase Frequency × Customer Lifespan
Customer Support & Resolution KPIs
Customer support is a major brand experience touchpoint, it’s not all about solving tickets or just slogging through inquiries. The following KPIs underscore where your team is meeting expectations in the moments that matter the most to customers after the sale is made.
At a Glance: Customer Support & Resolution KPIs
| KPI | What It Measures | Why It Matters |
|---|---|---|
| First Response Time | Time until first agent reply | Majority of customers say immediate response is critical and speed signals care |
| Average Resolution Time | Time to fully resolve an issue | Shorter resolution means less frustration, lower ticket volume, higher trust |
| First Contact Resolution (FCR) | Issues resolved in one interaction | Fewer touchpoints allow for lower costs, happier customers, better retention |
| Chat Wait Time | Time customers wait before first chat response | Studies show 63% prefer live chat, 40% are frustrated by long phone waits, and speed matters most |
First Response Time
First Response Time is the average time it takes your support agent to respond to a customer’s initial outreach or inquiry. 90% of customers say that an immediate response is “very important” as speed signals care and a brand’s commitment to better service.[*]
Here’s how to calculate First Response Time:
First Response Time = Total time to first response / Number of inquiries
Average Resolution Time
Average Resolution Time is how long it takes (on average) to fully take on and resolve a customer’s issue. Long waits lead to more frustration. Shorter resolution times are trust fortifiers and eventually work to reduce ticket volumes over time, saving your customers and teams time.
Here’s how to calculate Average Resolution Time:
Average Resolution Time = Total resolution time / Number of resolved cases
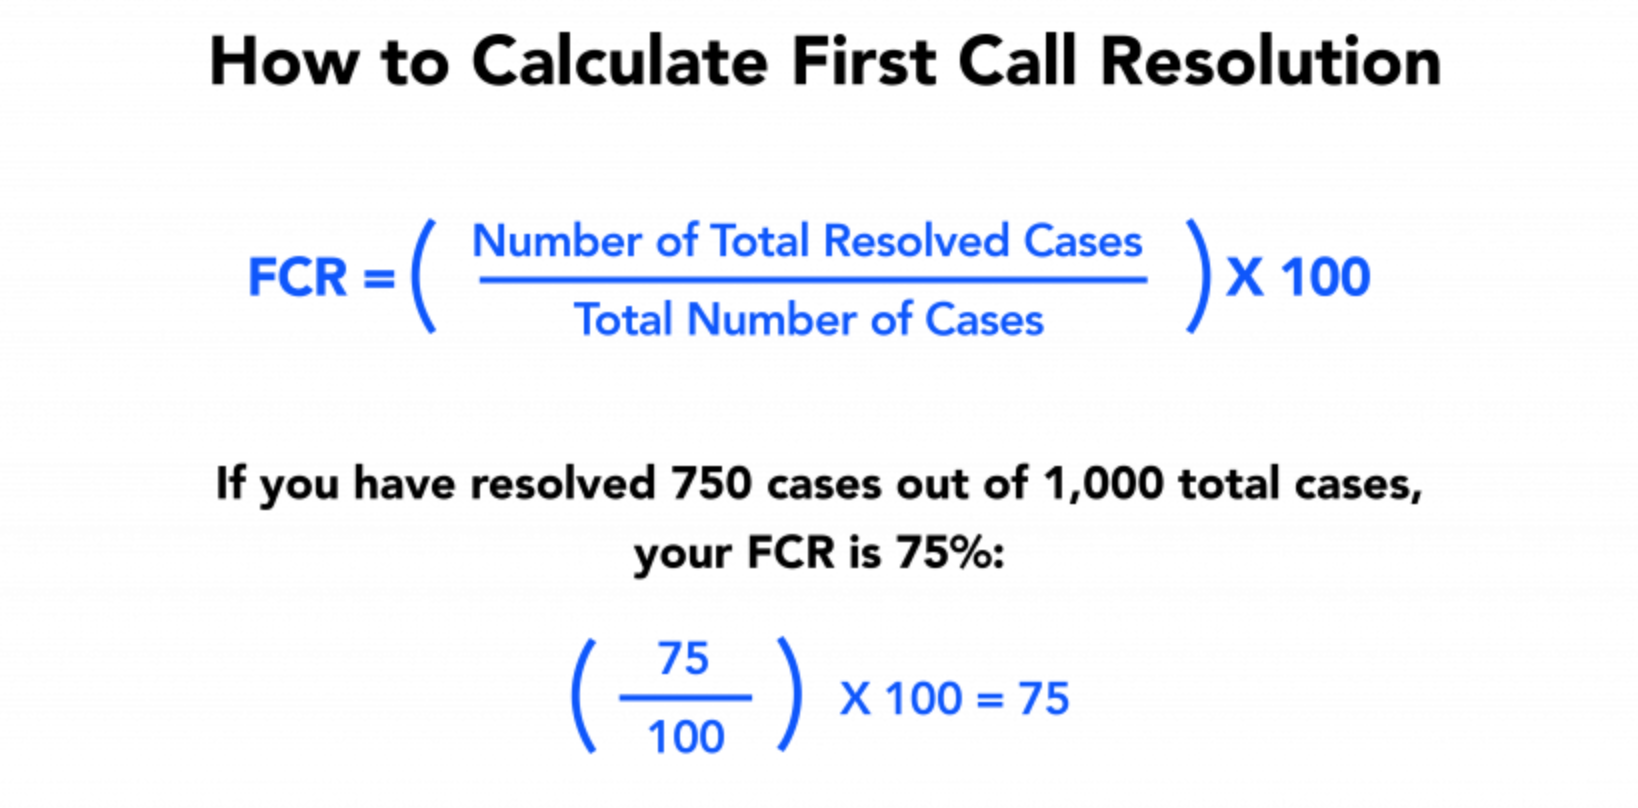
First Contact Resolution (FCR)
First Contact Resolution (FCR) is the percentage of issues taken on and resolved during the very first interaction between the customer and your agents. A high FCR speaks to fewer touchpoints, cut costs, and happier customers. A trifecta that leads to retention, resolution, and revenue.
Here’s how to calculate First Contact Resolution (FCR):
FCR = (Cases resolved on first contact / Total cases) × 100
Chat Wait Time
Chat wait time is the average waiting time a customer spends in a live chat queue before getting their very first response. Real-time support is not actually real-time when you’re making people wait longer than 10 minutes to be seen. 63% of customers prefer live chat, 40% of customers are annoyed by long wait times on the phone, and 52% of customers want queries solved within 24 hours.[*] Do not drop the ball by making them wait.
Here’s how to calculate Chat Wait Time:
FCR = (Cases resolved on first contact / Total cases) × 100
Acquisition & Conversion KPIs
Acquisition and conversion metrics track how efficiently your business attracts new users and converts them into paying customers. They help quantify the performance of your marketing, sales, and onboarding efforts.
At a Glance: Acquisition & Conversion KPIs
| KPI | What It Measures | Why It Matters |
|---|---|---|
| Customer Acquisition Cost (CAC) | Cost to acquire one new customer | Signals growth sustainability, studies show it ranges from $86 (eCommerce) to $1143+ (higher education) |
| Conversion Rate | Percentage completing desired actions | Direct revenue driver and shows effectiveness of marketing and UX |
| Trial-to-Paid Conversion Rate | Free users who become paying customers | Validates product-market fit and onboarding effectiveness |
Customer Acquisition Cost (CAC)
Customer Acquisition Cost (CAC) is how much it actually costs to acquire a new customer. CAC signals whether your growth is sustainable or you’re bleeding cash. CAC varies across industry going as low on average as $86 in eCommerce to as much as $1143 in the higher education and college spaces.[*]
Here’s how to calculate Customer Acquisition Cost (CAC):
CAC = Total marketing and sales costs / Number of new customers acquired
Conversion Rate
Conversion Rate is the percentage of users who take up a desired action and do it to completion (think of signing up for an account or the newsletter or even finishing a purchase).
Here’s how to calculate Conversion Rate:
Conversion Rate = (Conversions / Total visitors) × 100
Trial-to-Paid Conversion Rate
Trial-to-Paid Conversion Rate tracks the percentage of users who convert from a free trial of your product or service towards a paid account. Doing well in this arena signals product-market fit and effectiveness when it comes to onboarding.
Here’s how to calculate Trial-to-Paid Conversion Rate:
Trial-to-Paid Rate = (Paid conversions / Total trial users) × 100
Digital Experience & Behavior KPIs
These metrics measure how users interact with your website or app: how engaged they are, how easily they find what they need, and where they may drop off. These KPIs help you assess the effectiveness of your digital experience and identify friction points in the customer journey.
At a Glance: Digital Experience & Behavior KPIs
| KPI | What It Measures | Why It Matters |
|---|---|---|
| Cart Abandonment Rate | Shoppers who add items but don't check out | Ranges from 54% (pet care) to 82% (luxury), but ultimately reveals checkout friction |
| Pages per Visit | Average pages viewed per session | Indicates engagement level and can also signal navigation confusion |
| Direct Traffic Share | Visitors typing URL directly vs. search/ads | Measures brand strength and direct customer relationships |
Cart Abandonment Rate
Cart Abandonment Rate is the percentage of users who add items to a cart but don’t pull the trigger when it comes time to check out. Studies found that luxury and jewelry had the highest cart abandonment rates at 82% where pet care and vet services had the lowest at 54%.[*]
Here’s how to calculate Cart Abandonment Rate:
Cart Abandonment Rate = (Abandoned carts / Initiated checkouts) × 100
Pages per Visit
Pages per visit is the average number of pages viewed per a user’s session. More pages tend to indicate better engagement, but sometimes may signal customers getting lost in a cluttered interface. Context is key.
Here’s how to calculate Pages per Visit:
Pages per Visit = Total pages viewed / Total sessions
Direct Traffic Share
Direct Traffic Share is the percentage of users who visit your site by typing in your URL directly (as opposed to traditional search, ads, or referrals).
Here’s how to calculate Direct Traffic Share:
Direct Traffic Share = (Direct visits / Total visits) × 100
Measuring and Acting on Customer Experience KPIs
The real power in tracking CX KPIs lies in how you use these insights. It’s never enough to just know your NPS or resolution times, you need to connect those numbers to a larger scale picture that identifies root causes and helps you move fast to fix user issues. Insights without activity are merely window dressings.
Whether it’s running a leaner team or scaling your global CX operation or CX platform, the goal is clear: turn customer data into smarter decisions and measurable impact points. Collect the right data, visualize in a way that teams across the board can act on, and hone your team’s ability to respond in real time.
Tools and Sources
Measuring CX effectively means having access to data from all parts of your customer journey. Yes, this means qualitative and quantitative as well as passive and active. Keep in mind that no single tool gives you the full picture, so a layered approach works best. Here’s where that data resides:
- Surveys: These are your go-to for direct customer feedback. Use them to capture sentiment metrics like NPS, CSAT, and CES right after key touchpoints
- Support Platforms: Tools like Zendesk, Intercom, or Freshdesk help track service KPIs like first response time, resolution time, and FCR
- Web Analytics: Google Analytics, Hotjar, and similar platforms show how users behave on your site, these are crucial for ensuring you know where there are drop-offs, bolstering conversion rates, and curbing cart abandonment
- Social Listening Tools: Platforms like Sprout Social or Brandwatch will watch customer sentiment and emotional intensity across social media, reviews, and forums
- CRM and Billing Systems: Systems like Salesforce or HubSpot house vital data for tracking CLTV, churn, and retention over time
Each tool will grant you triangulation as to what customers are feeling, doing, and deciding, this way you can intervene strategically and instantaneously.
Building Your KPI Dashboard
Your KPI dashboard is a command center where teams align, spot patterns, and decision-make decisions on the fly. It is more than your typical bar charts and percentages. Here’s what keeps your powerful CX dashboard from transforming into a data graveyard:
- Real-time Monitoring: Be sure to catch issues as they happen. Real-time data means you can respond before support backlogs becomes a brand liability and crux
- Integrated Views: Combine data from surveys, support tools, and analytics platforms into a single and user-friendly readable view that doesn’t scare off less tech-savvy team members. The goal? Full-funnel visibility
- AI-Powered Insights: A lot of dashboards employ machine learning to pick up on trends easy to overlook whether it’s rising frustration via a touchpoint like a bad page or possible spikes in churn after a feature rollout goes wrong
- Custom Alerts & Thresholds: Set rules to automatically notify your team when KPIs fall short or overcome key benchmarks, no red flag slips through the cracks and no great performances are left unrewarded
Keep your dashboards lean. Too many metrics usually means analysis paralysis, if you focus on the KPIs that align with your current CX goals, that means improving onboarding, shortening resolution times, or boosting loyalty.
5 Common Mistakes When Tracking CX KPIs
Tracking KPIs correctly matters more than performatively collecting them for the sake of doing so. Too many CX teams face the same time sinks and traps whether it's just measuring vanity metrics, drowning in unusable data, or optimizing for the wrong outcomes. These missteps just waste precious time and actively steer your strategy towards irrelevance.
Here are five costly mistakes to avoid when measuring customer experience:
Tracking Too Many KPIs at Once
More metrics do not always capture the strongest insights, less can be more if done correctly. When you're keeping a score of 30 different KPIs, you're just fishing for fishing's sake and collecting barrels of useless data.
Analysis paralysis sets in, your priorities get muddled, and the CX team burns out trying to improve all facets in one shot. Ruthlessly prioritize at most just 5-7 KPIs that directly link to your current business goals and ignore everything as white noise until your goals shift (as they will). If you're focused on retention this quarter, your dashboard needs to be just retention-specific metrics rather than every possible data point under the sun.
Ignoring the "Why" Behind the Numbers
Your NPS dropped 10 points. Your churn rate spiked. Your First Response Time doubled. Great, you noticed. Now what? Too many teams stop at identification and never dig into root cause analysis. A KPI without context is just a number on a screen.
Treating KPIs as endpoints instead of starting points causes this problem. Build investigation into your workflow. When a KPI moves, dig into customer feedback, review support tickets, talk to your team. The metric tells you something has changed. The investigation tells you what to do about it.
Measuring Activity Instead of Outcomes
Agents responding to 100 tickets per day sounds impressive until you realize none of those issues were actually resolved. Conversion rates climbing feels like a win until you notice retention rates tanking. Activity metrics make you feel busy. Outcome metrics tell you if you're making progress.
Optimizing for throughput over impact causes this disconnect. Anchor every activity metric to an outcome metric. Pair First Response Time with First Contact Resolution. Track conversion rates alongside Customer Lifetime Value. If your KPI doesn't connect to a business outcome, question whether you need it.
Setting Unrealistic Benchmarks
Industry averages are useful, but taking them as gospel can misalign your expectations and upset the overall strategy. Comparing your SaaS startup's NPS to a time-worn behemoth like say, Apple's NPS is a recipe for disappointment. Don't waste time comparing benchmarks against a competitor in a completely different market segment either, it may be tempting but it's just noise.
Start with your own baseline instead and be sure to track your performance over time, identify your trends, and set goals based on continuous improvement. External standards and optics will come later down the line. A 5-point NPS increase from your current baseline means a world more than matching an industry average that completely eschews your unique business model or customer base for the median outcome.
Forgetting to Close the Feedback Loop
Customers take time to fill out your surveys, leave reviews, and provide feedback because they want you to hear them out. If they never hear back, if nothing ever changes, if their input disappears into a void, they'll leave you high and dry and won't even tell you why. Treating customer feedback as data extraction instead of dialogue breaks trust.
Close the loop. Let customers know their feedback mattered. Send follow-ups, share what you've changed, and show them their voice has an impact. This approach improves response rates and builds trust, transforming passive customers into active advocates.
FAQs
Metrics track any and all data whereas KPIs are all about business-critical outcomes tied to growth and loyalty.
Start with what goals you have in mind. Churn? Take on CSAT, retention, and NPS. Better support? Track FCR and resolutions.
Real-time or weekly is most ideal for operational KPIs, monthly or quarterly for strategic ones like NPS or CLTV.
Talk to your customers to identify pain points and fix what’s broken. Ensure that you communicate improvements to your teams.